PULLMAN, Wash. — Will tomorrow’s skies be smoky or clear? Safe to breathe outdoors or better to stay inside? An updated interactive web tool offered by Washington State University provides 72-hour, close-to-home air-quality forecasts across the Pacific Northwest to help people answer such questions.
The tool provides information on fine particulate matter and ozone concentrations, as well as fire locations and intensity, smoke layers, meteorological conditions, and other data on an hourly basis for Washington, Oregon and Idaho, along with parts of surrounding states. Enter your location, and it produces a three-day rolling forecast, down to a 4-kilometer grid square.

“Think of it like a weather forecast, but for the air we breathe,” said Jun Meng, an assistant professor in the Department of Civil and Environmental Engineering in the Voiland College of Engineering and Architecture. “When we plan for the weekend or other events, we always check the weather. But with the intensifying wildfire situation, people are becoming more aware of the air quality and the need for this kind of forecast.”
The new, improved interactive map is among a series of updates to the Air Indicator Report for Public Awareness and Community Tracking, or AIRPACT6. Funded by the NW-AIRQUEST Consortium, made up of agencies and universities in the three-state region, the AIRPACT project provides information and guidance to meteorologists, officials making decisions about burn bans or health advisories, and the public.
AIRPACT was one of the first high-resolution air-quality forecasting tools in the country when it was launched by the Laboratory for Atmospheric Research (LAR) at WSU in 2001 and it has undergone periodic upgrades. Meng and the PhD students in his Air Quality Research Lab developed the latest version; he gave particular credit to students Priom Zarrah and Jahidul Islam.
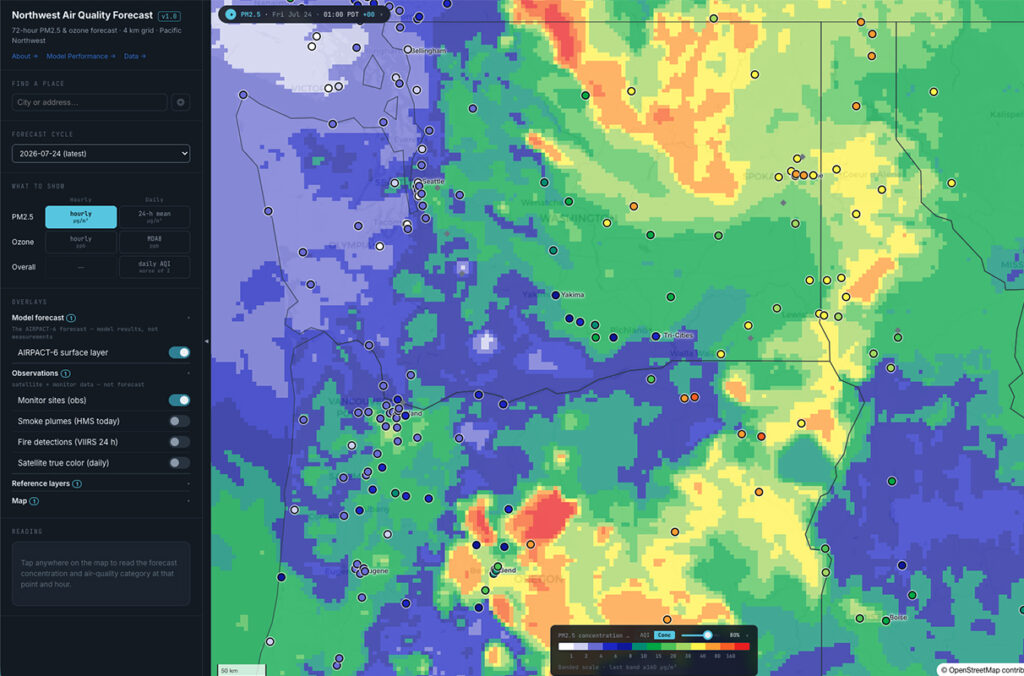
The interactive map gathers a wide range of data from sources including satellite imagery, emissions data and meteorological predictions. Each morning, the new interactive map automatically turns the latest data into a 72-hour forecast of surface PM2.5 — which is particulate matter smaller than 2.5 micrometers associated with wildfires, automobile and industrial emissions — and ozone levels for the region. You can select specific locations within the region or enter your own location into the search function for a detailed 72-hour time series.
Each morning, the new interactive map automatically turns the latest data into a 72-hour forecast of surface PM2.5.
Features of the new tool include hourly animation and daily air-quality index views, along with AQI category and raw data; real-time observations from the EPA AirNOW network that show how the forecast tracks reality; the ability to click anywhere on the map for a 72-hour time series; a browsable archive of past forecast cycles; and others.
Meng said that AIRPACT6 is a work in progress, as his lab strives to gather more data and work toward refining the forecast to an even finer scale and improving the representation of wildfire emissions. One of the strengths of the project is that the underlying data are available so people know what the forecasts are based on.
“It’s literally an evolving science project,” he said. “We are collaborating with state and local agencies, and we are providing something that we can validate. We evaluate over a season, and the next season we’ll update what we have missed.”
Media Contacts
- Jun Meng, WSU Department of Civil and Environmental Engineering, jun.meng@wsu.edu
- Shawn Vestal, WSU News & Media Relations, shawn.vestal@wsu.edu