A Washington State University instructor applied her interest in using color symbolism in data visualization to create a baby quilt that tracks average global temperatures over the last century.
Lisa Waananen Jones, a clinical assistant professor in the Edward R. Murrow College of Communication, will share her project Oct. 4 at Terrain 12, a free juried multimedia art and music event celebrating artists in the Spokane area. Terrain 12 offers a ticketed preview Oct. 3.
The project originated in Waananen Jones’s data visualization seminar class in the summer of 2018. She wanted to teach interactive graphics in ways that don’t require coding and web development skills, so her class made interactive visualizations without screens, such as drawing charts on the sidewalk with chalk and making worksheets for students to guess how tuition has changed over the past 10 years.
“As part of that, I started thinking about ways to present familiar news data in tactile ways,” Waananen Jones said.
News graphics about average global temperatures frequently employ a blue-pink color scale since most people intuitively see blue as cool and pink as warm, Waananen Jones said. That fits well with her idea to track average global surface temperature through a quilt, using blue and pink, which are stereotypical “baby” colors.
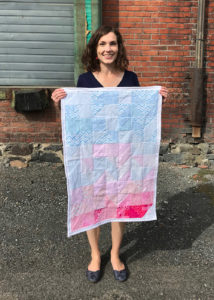
Waananen Jones hand-stitched a baby quilt that represents NASA data tracking average global surface temperature compared to the late-1800s pre-industrial baseline. Blue represents cooler than average and pink represents warmer than average temperatures for every year from 1880 to 2018. The quilt took her two weeks to make and measures 24 by 33 inches.
Waananen Jones said she does not have a lot of quilting experience, but her house is filled with quilts made by her mother and grandmother.
“Quilts are often passed down as family heirlooms and treasured because they’re a tactile link between generations, so the medium felt appropriate for a dataset that’s essentially about how our world is changing,” Waananen Jones said.
She said the quilt pattern has a half-square for every year since 1880, so it also functions as a timeline.
“At a glance, I can see a bit of what the Earth was like when my parents and grandparents and great-grandparents were born,” she said. “Even though I knew the whole pattern before I started making the quilt, I was still shocked to see just how much has changed between the year I was born and the years my kids were born.”
Waananen Jones’s son was born at the beginning of 2016, right after the announcement that 2015 was the hottest year on record.
“For a variety of reasons I felt a lot of ambivalence about bringing another baby into the world,” she said.” I didn’t have that in mind when working on this project, but I hope the quilt conveys that conflicted feeling I felt at the time.”
The quilt project was one of about 400 pieces selected for the exhibit out of the 1,316 submitted, according to an email from the Terrain team.
“It’s always been an interesting juried art show that’s run by people who are civic-minded and open to weird ideas,” Waananen Jones said. “So when I saw the call for submissions last summer (2018), I decided to submit a proposal for a bead curtain visualizing every person in Washington state and how they voted in the 2016 presidential election.”
The quilt project is inspired by other climate-data textile projects such as the Tempestry Project and Ellie Highwood’s crochet blanket, as well as patterns for “weather quilts” and “temperature blankets” that are made kind of like diaries to track your weather patterns for a year, Waananen Jones said. She said the warming stripes project, which allows people to geographically customize their “stripes” and use the pattern on various objects, also inspired her.
The Bed We Made For You:
Earth’s Annual Average Surface Temperature, 1880–2018

The quilt measures 24 x 33 inches with fabric selections corresponding to this key: